
View AskQV Data In A Qlik Sense Application
All of the blog posts which are presented through AskQV are available in an RSS feed. Qlik apps can read RSS feeds by connecting to them with a REST connection. We have therefore made available the entire AskQV dataset in a Sense application for you to explore. Let us know what you discover!
To get to the data, simply click on the Blog Data link at the top of any AskQV page. This will take you to the Application Overview in Sense, from where you can dive in and start exploring. Most sheets give the ability to configure the view by selecting Measures and/or Dimensions.
Perhaps you want to know who is the most prolific blog author out there and who has the greatest longevity? Well with a couple of selections you can find this on the Scatter tab.

Or perhaps you are interested in how many contributors there are to some of the biggest blogs out there? Well, the TreeMap sheet has a view of this.

If you want to view multiple different selected measures on the same sheet then the Single Dimension sheet allows this.
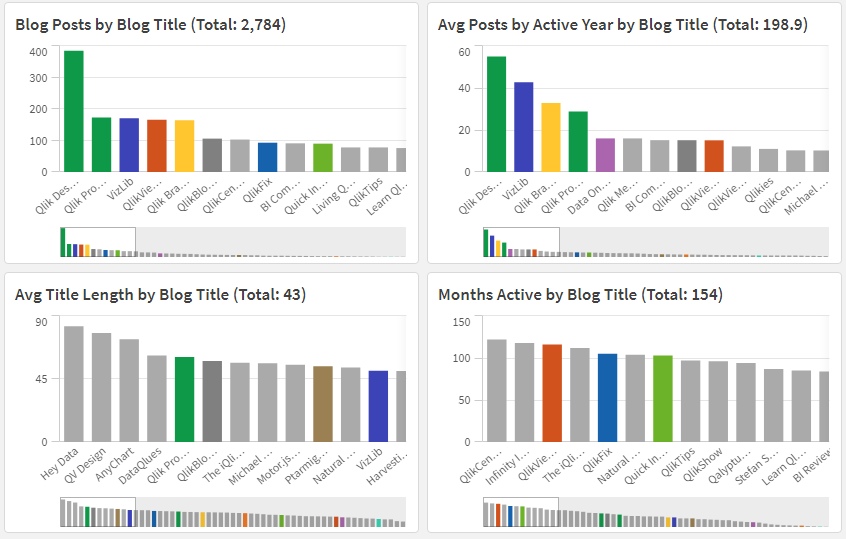
Well done to Richard Pearce for running Qlik Central, the blog which has been posting over the longest amount of time, and to Christophe Brault for putting in some seriously long blog titles over at Hey Data!
I’m genuinely interested in what you can find in the data. Please tweet us your findings, give us a mention on @askqv and use the hashtag #AskQVInsights. If you want to provide a new RGB code for a blog, or a new lat/long location then please do that via a DM and I will add these in when I can.
The data are presented in the Instant Sense Application template. The template application is free to download, and can be populated with any data you wish to send to it. This allows you to create a working application in minutes.
If you are interested in how the data is pulled from an RSS feed into the application then this blog post has all of the details. The load script is included in the Instant Sense Application download.
On the other hand, if you are wondering how the application is available to be use without the need to log in, then you will be wanting to check out this post on Qlik.dev which describes how to set it up on your own Qlik Cloud tenant.
https://qlik.dev/tutorials/embed-content-using-iframes-and-anonymous-access
Each time the site is accessed a new anonymous user is created via the API and that user is granted access to the correct space. Authentication of the user is then carried out via a JWT IDP and Analyzer Capacity is consumed. A separate scheduled call does the housekeeping of removing old users.
Many thanks go to Daniel Pilla at Qlik for providing the instructions and assistance to get this to fly.